Iron Experiments - June 2007 - Post Smelt Excavation
Date: 10 June, 2007
Location: Vinderheima
Premise / Questions:
We had received some questions about the debris field after a smelt. Before our double smelter on July 9 we laid down a clear
layer of fresh sand. On the 10th the July Dr. Ron Ross and Neil Peterson of Wilfrid Laurier University brought out the grid squares
and did a sketchmap of the debris field.
Tools and equipment:
- Plan frame - 1/2" copper pipe, soldered and pinned together designed by Dr Ross. The frame is 1 metre X 1
metre, subdivided by cord into 20 cm squares.
- Permatrace paper
- Graph paper
- String
- Coloured pencils
- Lead Pencils
- 100' tape
- Plumb bob
- Tent pegs (plastic, various colours)
- Compass
- Cameras
- Video
- scales for weights/mass and measuring sizes
This description was written by Ken Cook. This dig was his introduction to some of these techniques and he recorded the
techniques used quite well. This makes this text a good introduction for other interested parties.
This is work which involves a high attention for detail, an ability to
draw and the patience to record the details as found. Since any small
detail may be the key to un-locking an archeological mystery, it
behooves the archeologist to record everything, even if it seems
irrelevant.
Dr Ron and Neil used those really cool plan frames, which made layout very easy within the 1 meter squares.
The first thing Ron did was layout a base line for the site. Normally,
the baseline runs North - South if possible. In this case Ron laid out
the baseline so that it ran along the axis of the smelting site and
then took a bearing with his compass to get the relation of the
baseline to true North.
Next, he laid out 1 meter intervals along the baseline and marked them
with the plastic tent pegs. These tent pegs then became the reference
points against which the plan frames were set.
The next step involved setting up the tracing paper so that the
baseline ran down the centre of the paper. The co-ordinate system
set-up by this method runs on the military grid system. In this case,
everything EAST of the baseline was a positive number. Everything WEST
of the baseline was a negative number. The baseline has a ZERO point.
Hence everything within the excavation now has a co-ordinate which
locates it precisely with respect to the baseline and the EAST/WEST
direction. All measurements are in Metric.
The baseline represents SITE NORTH, and this is not always TRUE NORTH.
TRUE can be obtained by survey techniques.
RECORDING the DATA:
Ron and Neil talked about a KEY or LEGEND. This KEY is how objects are
marked on the plan diagramme of the site plan. It is very important to
be consistent when recording objects within the plan and maintaining
the correct KEY for the same type of objects. i.e.: always mark slag
debris with "DOTS" etc.
Object resolution is also a concern since the record has to be
detailed enough in order to capture the information you want. It is my
understanding that things 1 cm and larger are drawn as discrete
objects, while things less than 1 cm are shown as areas, usually with
descriptive notes attached.
The recording of data can be done in lead pencil only, but it makes
sense to record data in colour in order to separate types of data and
also make patterns more readily apparent.
The scope of the "DIG" needs to set with regard to the nature of the
site, the material that needs to be included in the analysis and the
material provides context only.
Context material sets the "tone" of the dig I think, in other words,
it is rather like a signpost letting you know when and where the next
town is. Material for analysis is the meat and potatoes of the dig,
and this is where most of the physical effort is expended.
Cameras are a must, they can provide both context and analysis
material for the site in general and for the 1m X 1m square plans.
They can help identify patterns and may show objects and patterns
which are not readily apparent to naked eye. A full suite of pictures were taken with the
digital camera recording each 20cmx20cm square. These pictures are not reproduced here. Extreme care
must be take to ensure that such pictures are accurately labled with the grid location and scale.
Copious notes are a must, both for context setting and for data
recording. Temperature, humidity, geology, geography, altitude,
latitude soil types, pH, climate and climate patterns (if known) are
just some of the things which can set context and provide data for
analysis of the site. For the prupose of this "dig" this data was not collected as the raw
material was deposited the day before and would not be impacted by these factors - yet.
As I mentioned before, attention to detail is very important, so is
not having a set of blinkers on when recording data. Drawing skills
are important as well, these can be developed over time and with practice.
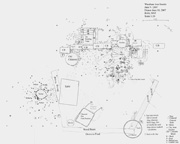
The final cleaned up version of our sketch map
Some Discussion Points:
This text is taken from our own observations and discussions with Kevin Smith at the Haffenreffer Museum.
It has been edited to make it a single text block rather than attempting to attribute specific thoughts or
questions.
- Archaeological Remains of Smelters
After 4-5 repeated smelts the base of the furnace stack itself
(beyond about 20 cm below tuyere level) was still essentially
unconsolidated, poorly fired or unfired clay cobb.
It is unlikely that anything this soft this would
preserve through 1000 annual freeze/thaw cycles and yet
archaeologists are always looking for the bottoms of the furnaces, expecting them to
be preserved. It makes perfect sense that the best preserved parts of
the furnace wall are going to be above and around the tuyere which will appear in the
archaeological record as loose plates as they fall over. It is also
important to realize that the base may well be ephemeral from an
archaeological perspective. We should expect to see unaltered earth, then
maybe disturbed earth, then the ring of raw cobb. Inside this would be
whatever remains from the extraction process and walls.
If you extracted the bloom from the top, the slag bowl might just be left in place.
That would leave you with the classic shaped bowl. Below that would
likely be some combination of ash, unburned or partially burned charcoal
and maybe charcoal fines. The looser this lower packing is, the more
likely there would be 'icicles' of slag from the bottom of the slag
bowl. There might also be the same shapes of bright white cast iron. We
have also seen plates of this metal forming between the slag on top of
the fines layer we use.
If you extracted the bloom from the bottom, you would first have dug out all the lower packing
material through the tap arch to leave a void. Then normally you would
try to puncture the slag bowl to let some of the liquid run into the
space created. This serves to help heat and loosen the structure of the
slag bowl. Next you either pound on the top or work to free the edges of
the slag bowl from the top. With some levering from the bottom, you work
to loosen the entire slag bowl and get it to drop down into the space.
Then the whole slag mass, with bloom still in place, is pulled out in
one large piece. In the past we have dragged this forward a couple of
feet, Then most of the loose slag is removed by striking with chisel
ended heavy iron rods. (This is how Skip and Lee extract their blooms)
So this method pulls the entire core out of the smelter. Nothing would
remain of the slag bowl save some fragments still attached around the
edges. There would be some mix of slag / ash / burned charcoal, very low
in the smelter base. This at the level of the raw cobb. I would expect a
much more disturbed artifact - likely one that pretty much results in
loose pile of mixed elements as it collapses. A trail of slag debris outwards from
the tap arch would also be an indication of this technique. Unfortunately it could
also indicate a large number of smelts on a single location with the slag coming from tappings.
- Patching Walls
The patches in the walls finally burned/melted
through with subsequent influx of external packing material and
consequent production of excess glassy slag. And interesting, as well,
to find that 4-5 reuses was the limit for the utility of the patched
stack. This stack been standing for two summers / one winter. It would be
interesting to know how many
times in one summer a single cobb-built stack could be used before it
became necessary to tear it down and rebuild it, as the "typical"
structure of the Norse smelting sites is based on a series of
overlapping furnace bases representing the reconstruction of a furnace
on more-or-less the same site over and over again...yet it's not that
clear how much time (or how many smelts) each base in the "stack"
represents.
We are finding typically that our smelters loose
something in the range of 2 - 4 cm of wall thickness each use. This
effect is most drastic just above the tuyere. (We have found that tuyere
angle effects this - remember that this smelt had that angle at only 10°
due to winter slumping. The ideal has been found to be 22.5°.
The lower angle suggested that excessive melting would in fact take place.)
Also significant for this smelt was the double smelt. In the past we
have had a gap between smelts that allowed us to repair and patch up the
lost wall thickness.
The repair before this experiment was done using a clay that is known to
have a lower firing / melting point (local 'Blue Mountain Red'). This
likely was an important factor.
The heat profile in the smelter is a torus. This washes back over the
walls above the tuyere (relates to angle again). The distribution should
be roughly symmetrical. What happened was that the excessive erosion was
primarily on the right side of the tuyere - the area which was inset
into the bank and had a layer of ash and sand packing against it. Again
I would say this is significant. Free standing clay smelters can radiate
heat off their surface and thus avoid excessive heat build up. There is
some balance between clay properties and ideal wall thickness.
In our area it is pretty dry
from mid June through to mid August there is always a lot of rain In
September and October. The smelter had a piece of sheet steel over the
top through all this time, but the exposed surface (roughly half) was
open to winter snows. When the snow melted the interior base actually
had several inches of standing water in it (this at the level of the raw
clay cobb.)
So it may be that a single cobb wall smelter, especially if free
standing, would withstand even more uses - providing that it was fully
patched between smelts. This smelter had started to develop some fairly
serious top to bottom cracks - several of which were leaking jets of hot
gases. The cobb mix helps to tie together even cracked furnaces. My best
guess is that after 5 - 6 uses of the furnace that it might just be too
damaged to continue using the same structure. The damage done during the
extraction process is actually more significant to the ability to re-use
the structure. Most of the patching is done at the base around the tap
arch - most especially if a bottom extraction is used. Skip and Lee have
never gotten any more than two uses of a Flue Tyle furnace - and there
is almost no wall erosion with that system. The base at the tap arch is
the problem.
Depending on your access to clay (problematic in Iceland) building a new smelter is not a
big deal. At best two days for two people (that is including digging and
preparing the clay). Given the physical difficulties of top extraction
(heat related), and the vast reduction in charcoal required for a second
'hot swap' smelt, it may just have been more efficient overall just to
re-build entirely.
- Soil Patterns
Icelandic archaeologists tend to look for
burned/oxidized/intensely fused soil beneath and around the furnace base
to convince themselves that they have found a furnace base. Yet, if the
lower 15-20 cm of the furnace stack itself, below the tuyere, is still
unfired clay and the charcoal charge beneath the tuyere remains unburned
(and I well remember finding unburned paper in the base of the furnace
we ran in 2002), it seems questionable that the sediment/matrix/soil
beneath the furnace will always be fused/heat-reddened/burned/fired and
perhaps questionable, as well, that the matrix outside the cobb core
will always be intensely thermally altered unless there has been a
disaster, like having the wall melt through. I would suggest that there
is minimal to zero effect on the condition of
the underlaying soil.
Remember however that when we dug in this smelter,
we cut a larger hole then back filled the gap between the cobb cylinder
and the undisturbed ground with that ash and sand insulation layer (also
provided drainage !) We also raise our smelters up and create a base
layer with charcoal fines. We did this initially to provide insulation
from the damp soil underneath - which proved not a problem. It also
allows the slag bowl to settle slightly below our estimate of its
correct level. If you simply used bare earth for your base, then
remember the slag bowl would form on top and transfer heat directly. I
would think that you might end up with more of a flat bottom to the slag
bowl if you worked directly on the soil. The distance of the tuyere from
the base earth layer is likely the greatest effect.
All this suggests (yet again) things that we may be doing that are
different that what was done in the Viking Age. I will take some more
images of the weathering smelter from 2004. What is happening there is
that the sintered clay is becoming a standing ring surrounded by a wide
smear of clay mud. As the ceramic is exposed, it cracks from freezing
and largely falls into the hollow where the slag bowl was extracted. Any
visible heat effect is limited to the walls of the smelter itself.
We have always dragged off any slag that leaks out of the smelter away
from our work area as soon as it cools enough that we can pick it up.
This mainly to keep our work area clean and safe to move around it. This
last smelt we had a huge amount of just waste glass slag. It mostly had
enough iron contained to turn it black - but not much more of than that
(not magnetic or we would have re-cycled it). Originally I wanted to
also record our slag volumes and weights - but with the extra produced
because of the hole in the smelter this information is not helpful to an
understanding of ore to bloom conversions. Anyway, I'd guess we have at
least enough of this material to fill two milk crates.
 Dark Ages Re-Creation Company